
Orhan und Olvier haben herausgefunden, dass unsere KI Pipeline ausschliesslich RDF im Cube Schema (https://cube.link/) erstellt. Das ist super für Datensätze, welche Beobachtungen/ObservationenMessungen enthalten. Andere Daten (wie z.B. Verzeichnis der Strassennamen) ohne Observationen kann die Pipeline nicht so gut handhaben, denn es formuliert dann Dimensionen als Observationen, das ist falsch.
Wir haben beschlossen, uns für diesen Hackathon auf Datensätze mit Messungen/Observationen zu beschränken. Die Pipeline bauen wir dann später um, damit auch andere Daten sauber verarbeitet werden können.
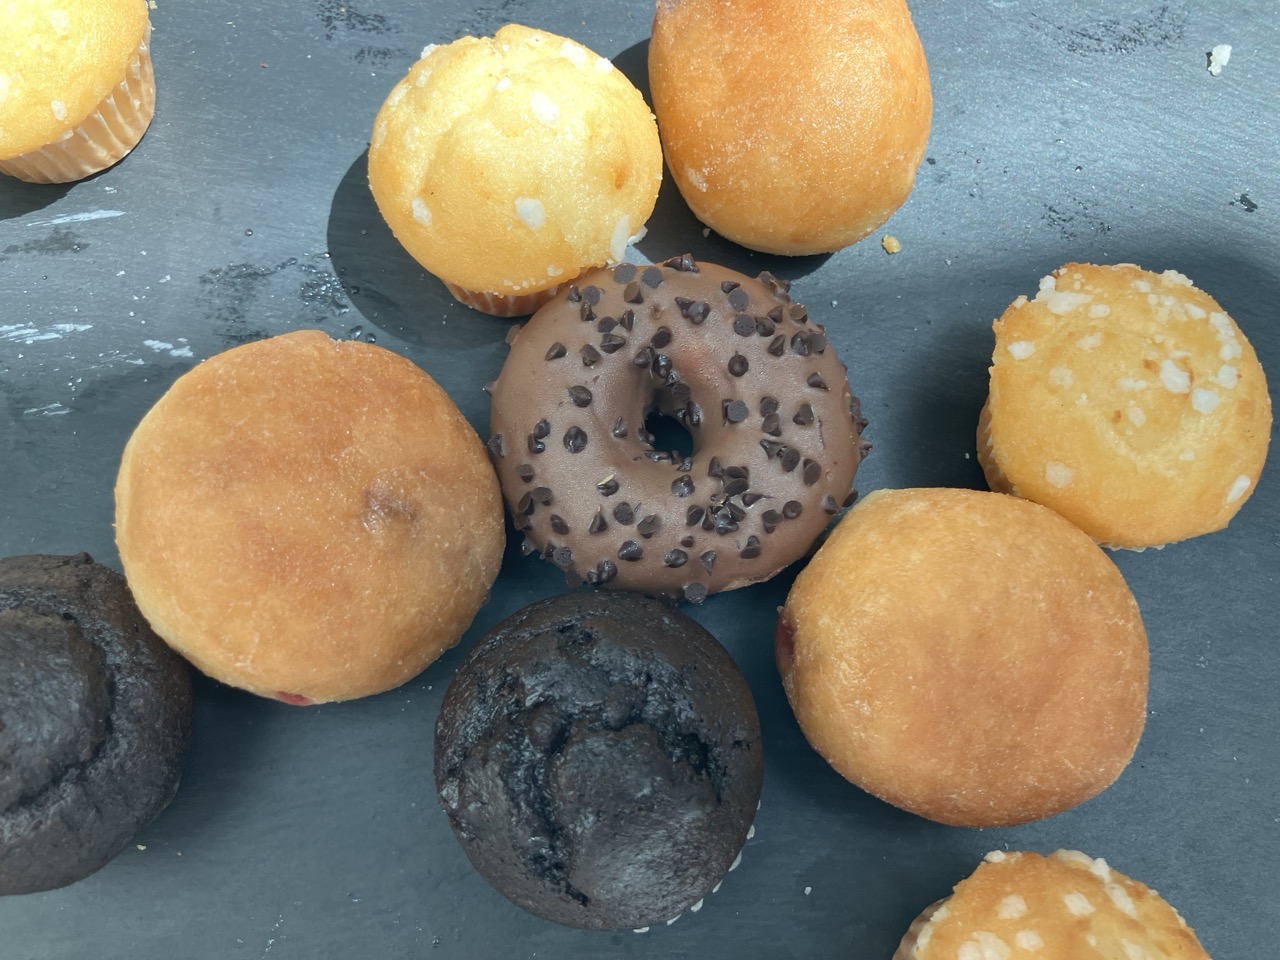 Over lunch & desert (pictured above 😋), we discussed how automation could support users of the platform: in the future, this could be to answer general questions via RAG, as well as to recommend datasets from the catalogue. Today, we want to focus on a specific need of data analysts: to estimate the degree of harmonization of a set of datasets, suggest compatibilities and pitfalls from a methodological perspective. This is something I can support with the
 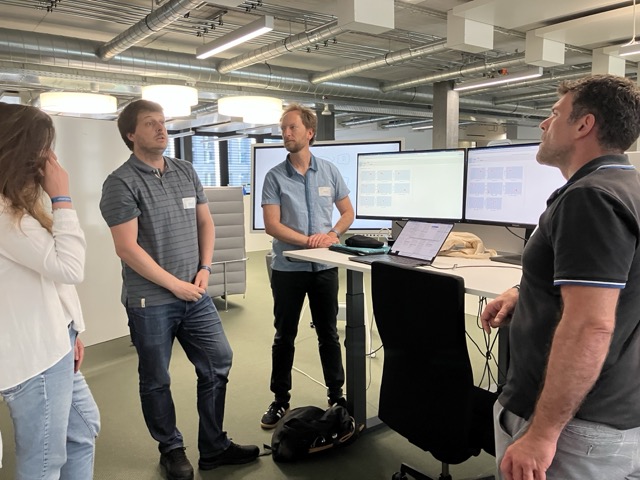 In the morning we got demos of the platform and explored a couple of use cases, including this dashboard visualizing regional health indicators from an HSLU research project.