
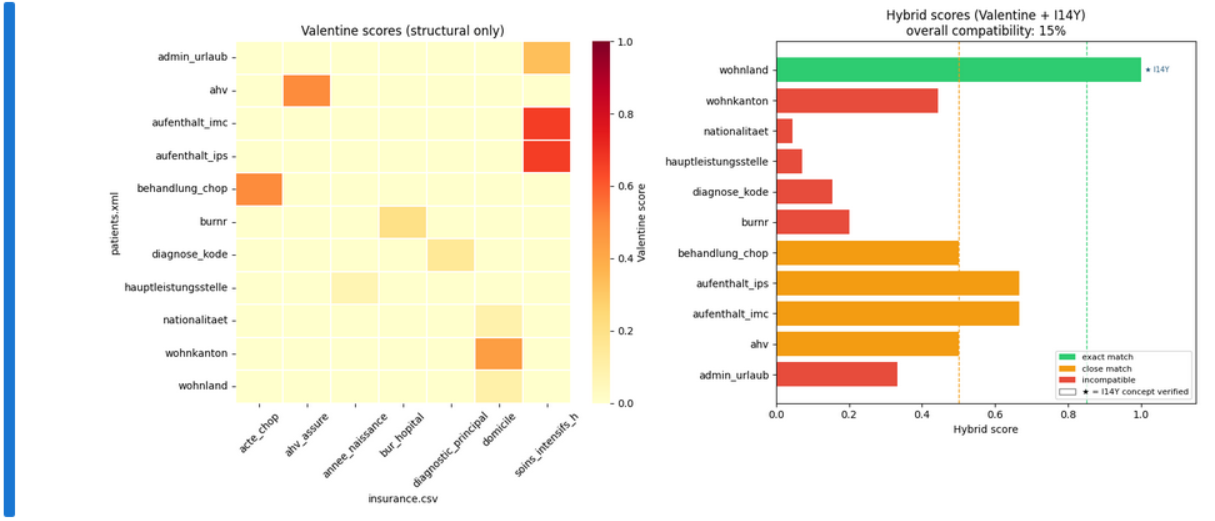
 Initial visualization of the Valentine scores of datasets. Fixed notebook uploaded to Renku.
4 months ago
~
Oleg Lavrovsky
Added an interesting presentation of the Valentine project from TU Delft
4 months ago
~
Oleg Lavrovsky
Variables for S3 bucket (where ld.bs.ch Qlever reads the rdf files): https://gitlab.zazuko.tools/stabs/ld-pipeline/-/settings/ci_cd#js-cicd-variables-settings
4 months ago
~
Jonas Bieri
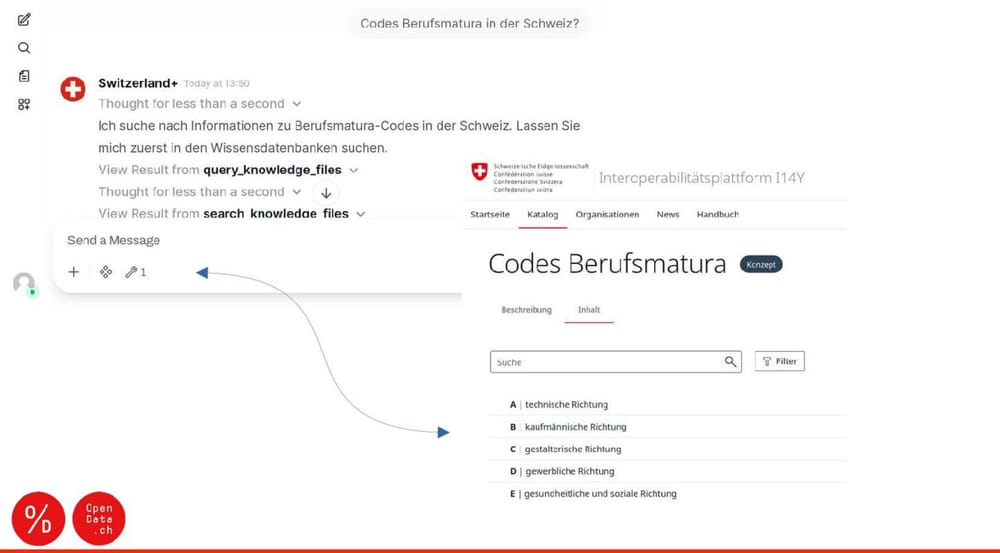 Sketch from a blog post I wrote in February, on Trustable Integration. Seems relevant today ;-)
4 months ago
~
Oleg Lavrovsky
Possible analytical dimensions
1. Economic Stability
GDP, GDP growth, GDP per capita, inflation rate, unemployment rate, government debt, income category, innovation index rank.
2. Services Trade
services trade receipts/expenditures, total services trade, Swiss trade share, top sectors.
3. Direct Investments
direct investments abroad, Swiss investment share.
4. Goods Trade
exports/imports, total goods trade, Swiss trade share, trade partner rank.
Possible objective: Provide a structured view of public selected economic indicators to support country monitoring and user-driven evaluation over time.
4 months ago
~
Alfa Diop-Wicki
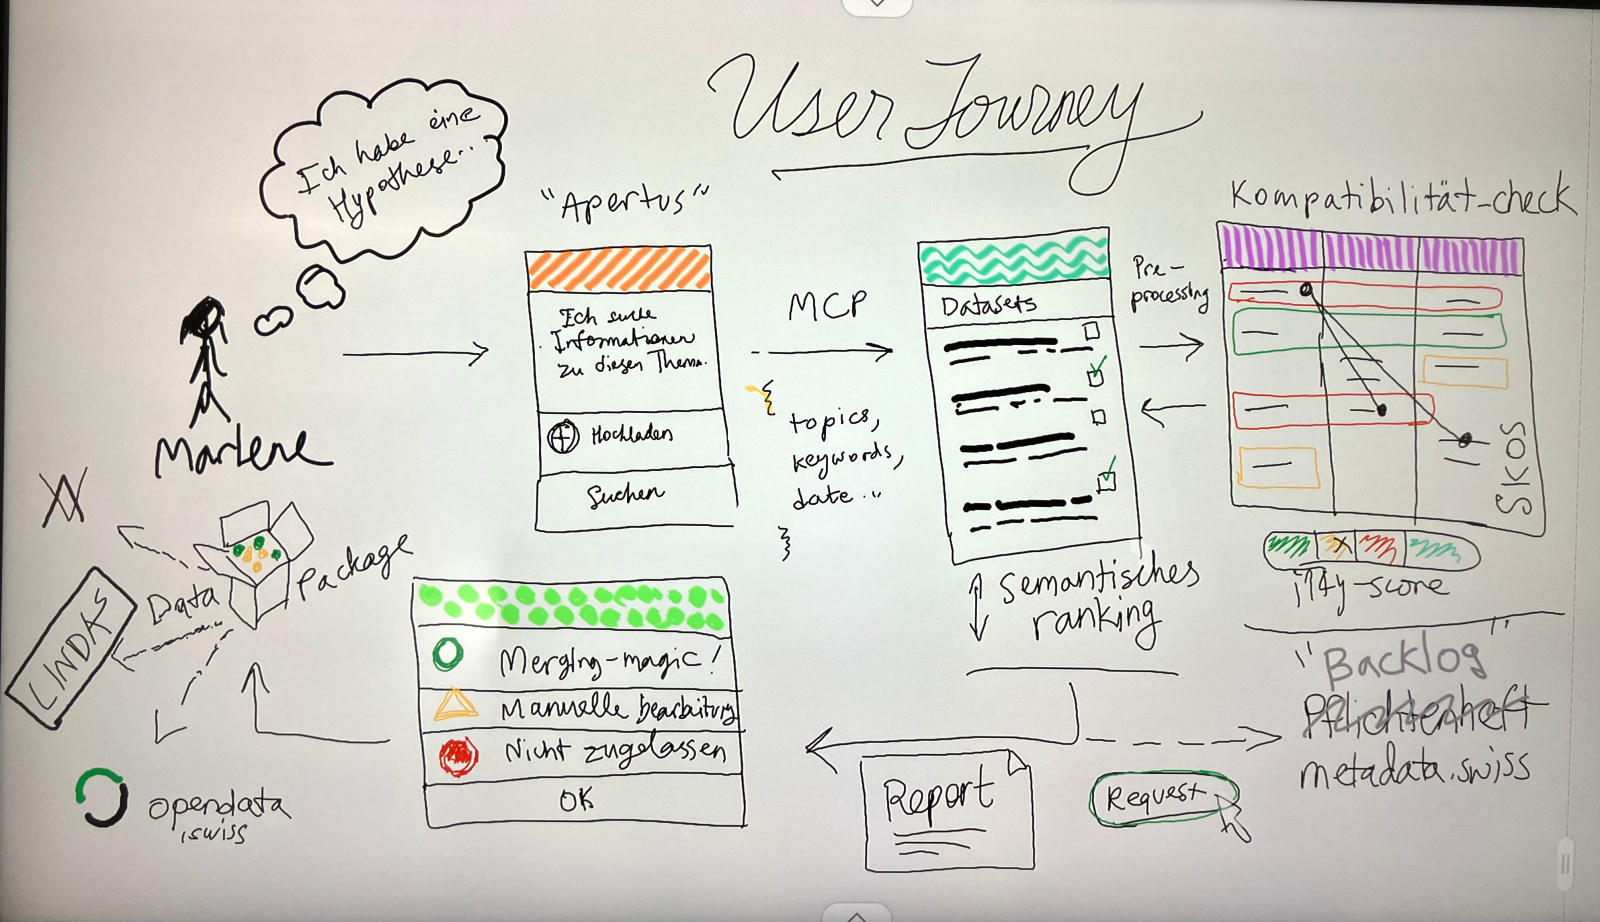
In a nutshell, here is what we want the initial prototype to do:
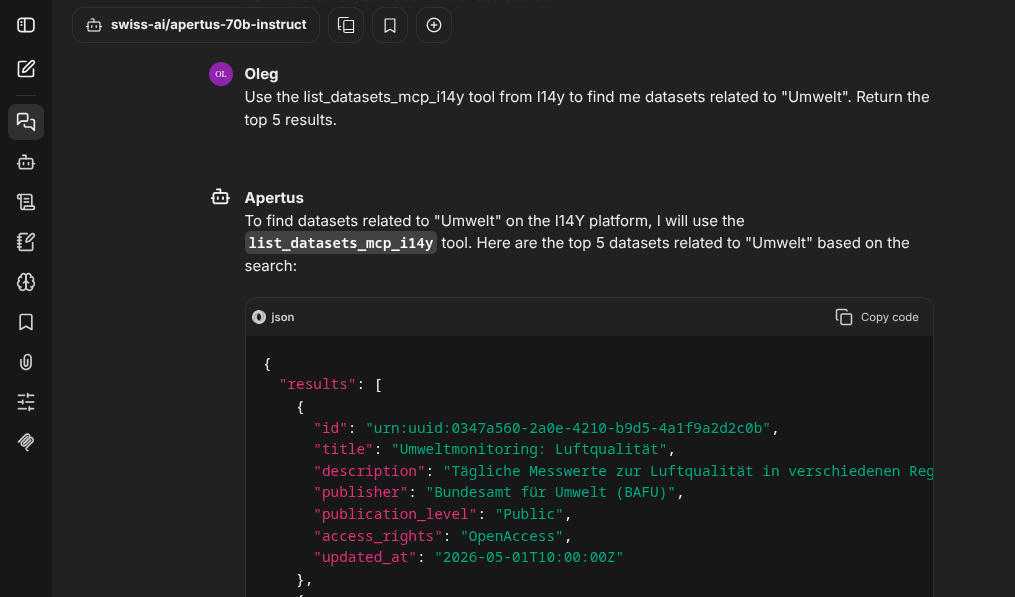
Take a user prompt from free text, as well as an uploaded file, then call an MCP service of the BFS i14y.admin.ch with this context, making sure to use the sessionID. The idea is that the MCP service will return a set of datasets based on the topics and needs described. The datasets are returned in a semantic ranking. The user chooses up to 3 datasets, and we calculate their structural compatibility, based on the metadata. Use the Valentine Python library to do this. Generate a report based on the user selection, with an indication of what needs to be merged or transformed in order that those selected datasets can be used together.
4 months ago
~
Oleg Lavrovsky
* dribs n. pl.: in small amounts, a few at a time